Client: City of Holland
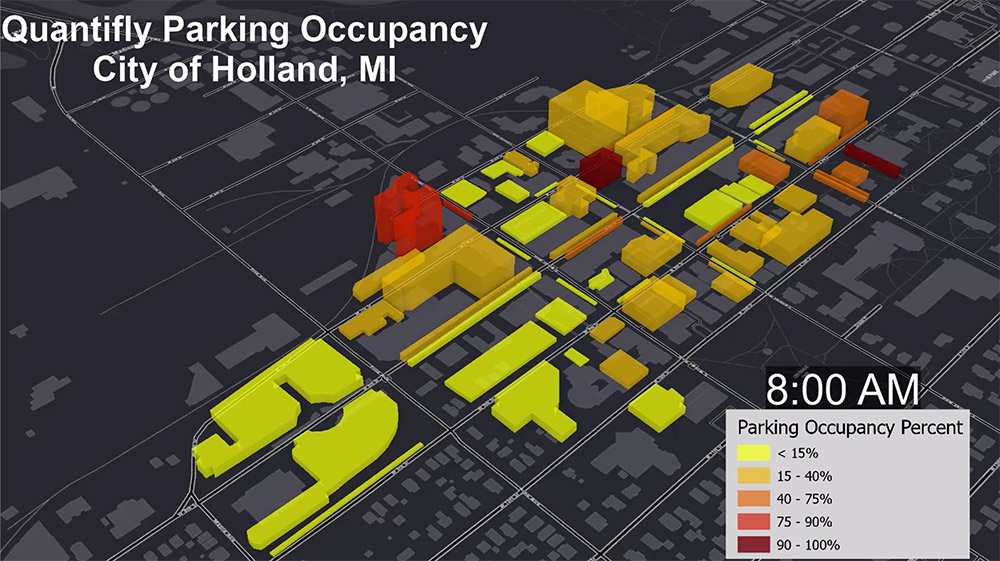
This study was conducted on Friday, June 28, 2019, and totaled 62 acres. Downtown Holland receives a lot of summer tourists who visit its shops, restaurants, and bars, so the observed conditions would represent a typical Friday during the tourist season. The animation of the hourly changes in parking occupancy was prepared for Quantifly by David Wasserman, AICP. Final deliverables to the client included an animation of the occupancy ratios over time, aerial orthomosaics, occupancy heat maps, graphs, excel data tables, and GIS shapefiles.

